One of the lesser-known features in ClickStack is Event Deltas. When users first open HyperDX, the ClickStack interface, and begin exploring their data, we often hear the same questions: How do Event Deltas work? When should I use them? What insights can they reveal?
In this post, we’ll unpack what Event Deltas are, how they can help accelerate root cause analysis for identifying why subsets of traces are slow, and how to interpret their visualizations effectively. We’ll also provide some general recommendations on using them effectively and share details on recent improvements that make the feature more powerful and flexible than ever.
ClickStack is a high-performance observability stack bringing the power, speed, and flexibility of ClickHouse to logs, metrics, and traces - all in an open-source package that anyone can use. Event Deltas continue that mission by making it even simpler to identify the root cause of an issue.
What problem does Event Deltas solve? #
Before diving into what Event Deltas are, let’s understand the problem they are designed to address. Observability data, especially trace data, is often high-volume and noisy, making it challenging to visualize patterns or isolate anomalies effectively.
When analyzing traces, users want to know why certain traces exhibit higher latency. This can be explored using traditional visualization techniques, but getting to the root cause is difficult and slow. It often involves a manual process: filtering spans with higher latency, grouping them by different attributes, and then comparing distributions to spot which attributes appear more frequently in the slow spans than in the faster ones.
This iterative process is time-consuming and repetitive, requiring constant filtering, visualization, and comparison.
Get started with ClickStack #
Discover the world’s fastest and most scalable open source observability stack, in seconds.
How do Event Deltas work? #
ClickStack's Event Deltas feature is designed to completely remove the need for this manual, repetitive analysis.
Event Deltas surfaces key attribute differences between fast and slow traces automatically. As an exploratory tool it is designed to help users quickly understand how and why performance changes occur within their traces. Rather than relying on pre-trained models or static alerting, Event Deltas analyze trace data dynamically - comparing the properties of normal and slow traces to highlight what has changed when performance regresses.
By contrasting the latency distributions of these trace groups, ClickStack automatically identifies which attributes are most correlated with slower behavior, whether that’s a new deployment version, a specific endpoint, or a particular user segment.
Instead of manually filtering and inspecting individual traces, Event Deltas instantly surface the key factors driving latency differences. This makes it easier to diagnose regressions, pinpoint their likely root causes, and visually connect them to the affected traces. The result is a fast, interactive way to explore observability data that fits the core spirit of ClickStack - helping users move from observation to insight with minimal effort.
How are Event Deltas unique? #
Many observability platforms use machine learning to detect and explain latency anomalies, typically by modeling latency or other KPIs over time against a partition key such as service endpoint, deployment version, or customer region. The model learns normal behavior, flags deviations, and may even suggest likely causes by identifying which attributes are most common in the anomalous data.
These approaches can be powerful for continuous monitoring, but they come with trade-offs. They require users to define areas of interest in advance, demand significant compute for model training and maintenance, and can generate false positives if not carefully tuned. Because they often run as scheduled jobs rather than interactively, they also sit apart from the real-time investigative workflow of SREs. While effective for automated alerting, they’re less suited for exploratory root cause analysis - precisely where Event Deltas shine.
How do I use Event Deltas? #
Suppose an SRE is investigating elevated latency in a specific service. In this example, we'll use our OpenTelemetry-based demo, available at play-clickstack.clickhouse.com. Let’s assume we’ve been alerted to high latency in a payment service, either through user reports or a traditional threshold-based alert.
From here, we open HyperDX, the ClickStack interface, and navigate to the Traces view for the payment service. Using the search filters, we narrow the dataset to only include traces from the payment service for the last day.
In the default view, traces appear in a table where each row represents a span. Instead of manually building visualizations to uncover the cause of the latency spike, we can simply switch to the Event Deltas tab in the left navigation.
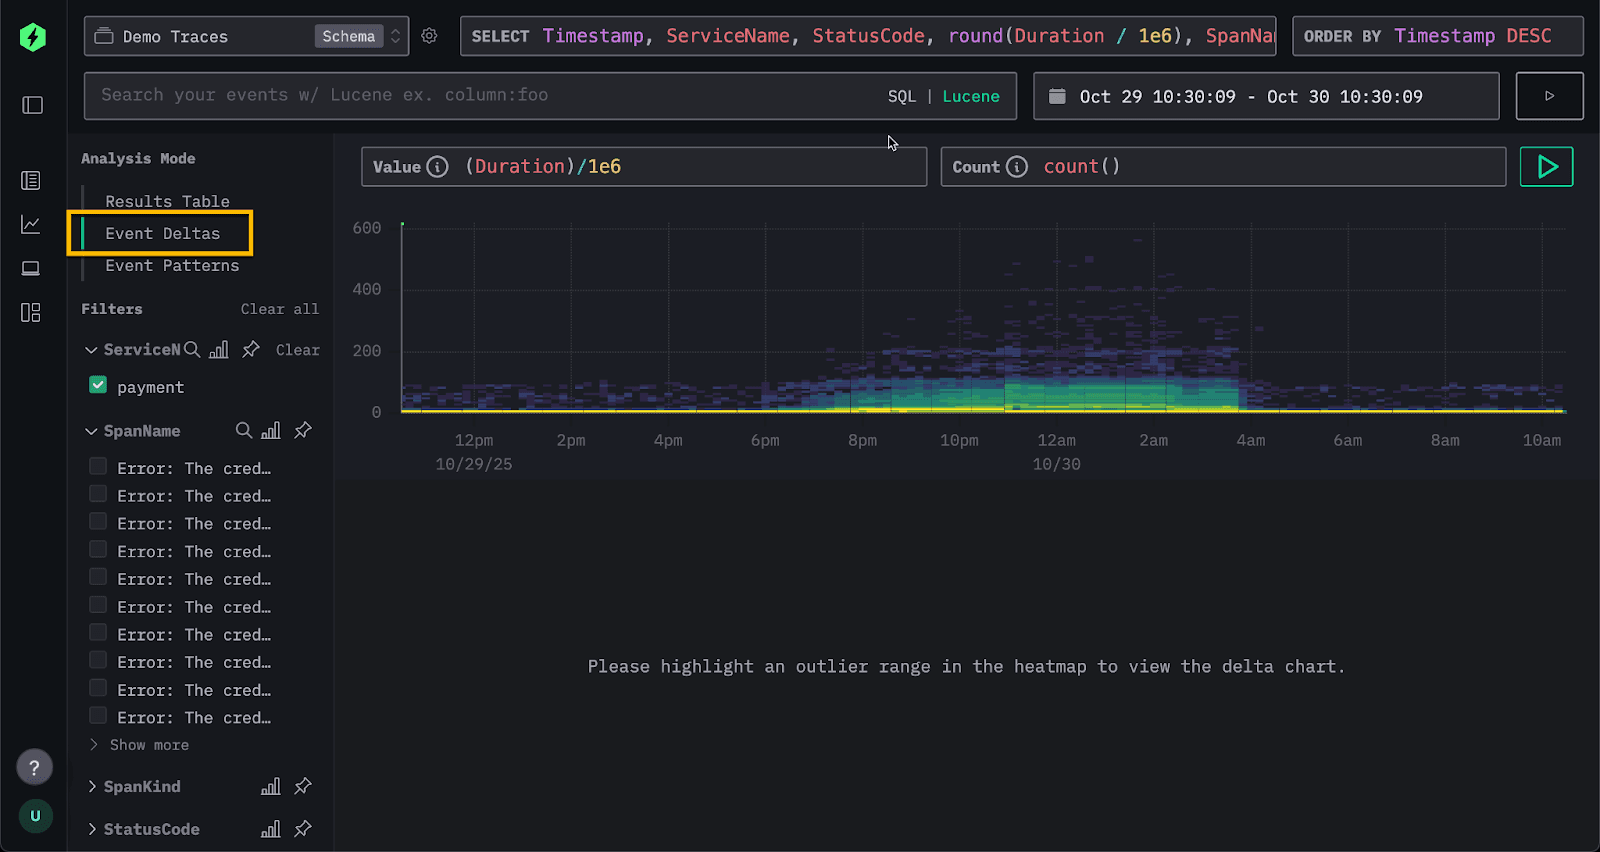
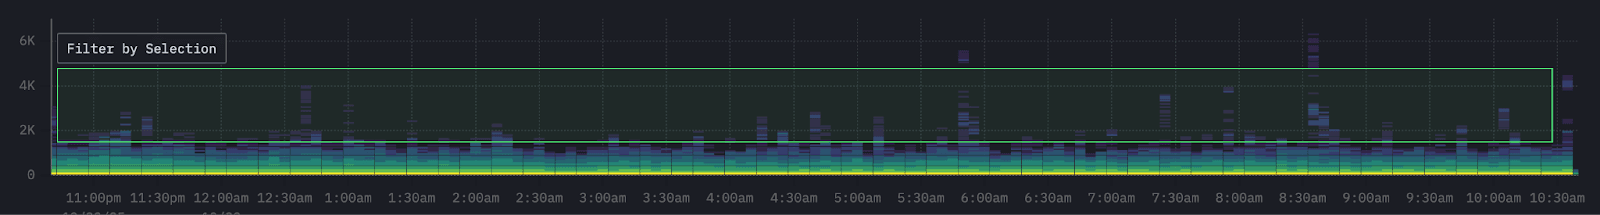
We're presented with a density heatmap showing span durations over time. The x-axis represents time, while the y-axis shows duration. Color intensity is, by default, based on the number of spans in a bucket (a simple count) with yellow areas showing higher concentrations of spans and blue representing fewer.
This visualization provides an immediate three-dimensional view of system behavior - how durations vary over time, across duration buckets, and by density within those buckets.
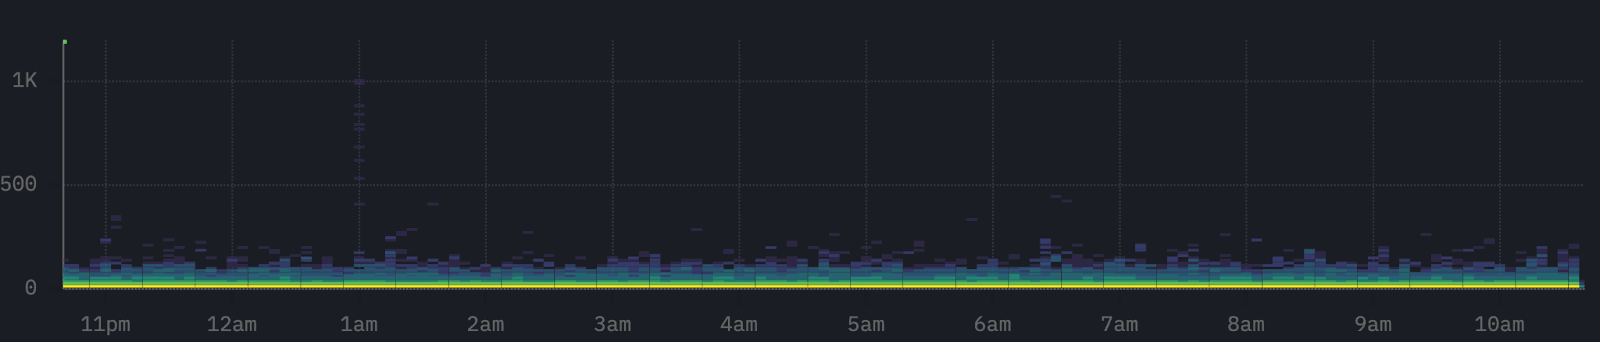
For a stable system, such as that shown above, spans should be concentrated in a narrow band. Whether this system is healthy depends on whether the latencies are within the expected range.
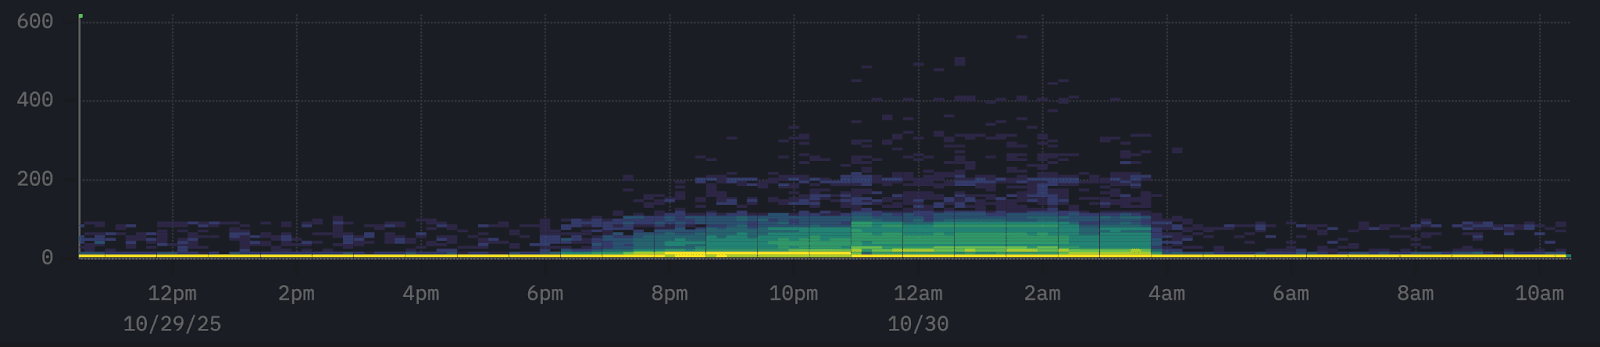
Conversely in the above example, while the system appears mostly stable - most response times cluster tightly along the x-axis indicating generally consistent performance - we can see a cluster of spans sitting above this band. These represent slower responses that warrant investigation.
Our objective is straightforward: are there any common attributes among these higher-latency events? If so, they could point us toward the underlying cause.
This is exactly where Event Deltas come in. We can simply select the area of interest by drawing a bounding box around the slower spans in the heatmap. We’ll refer to these as the outliers. Event Deltas will then identify the columns and key values most associated with those outlier spans compared to the rest of the dataset.
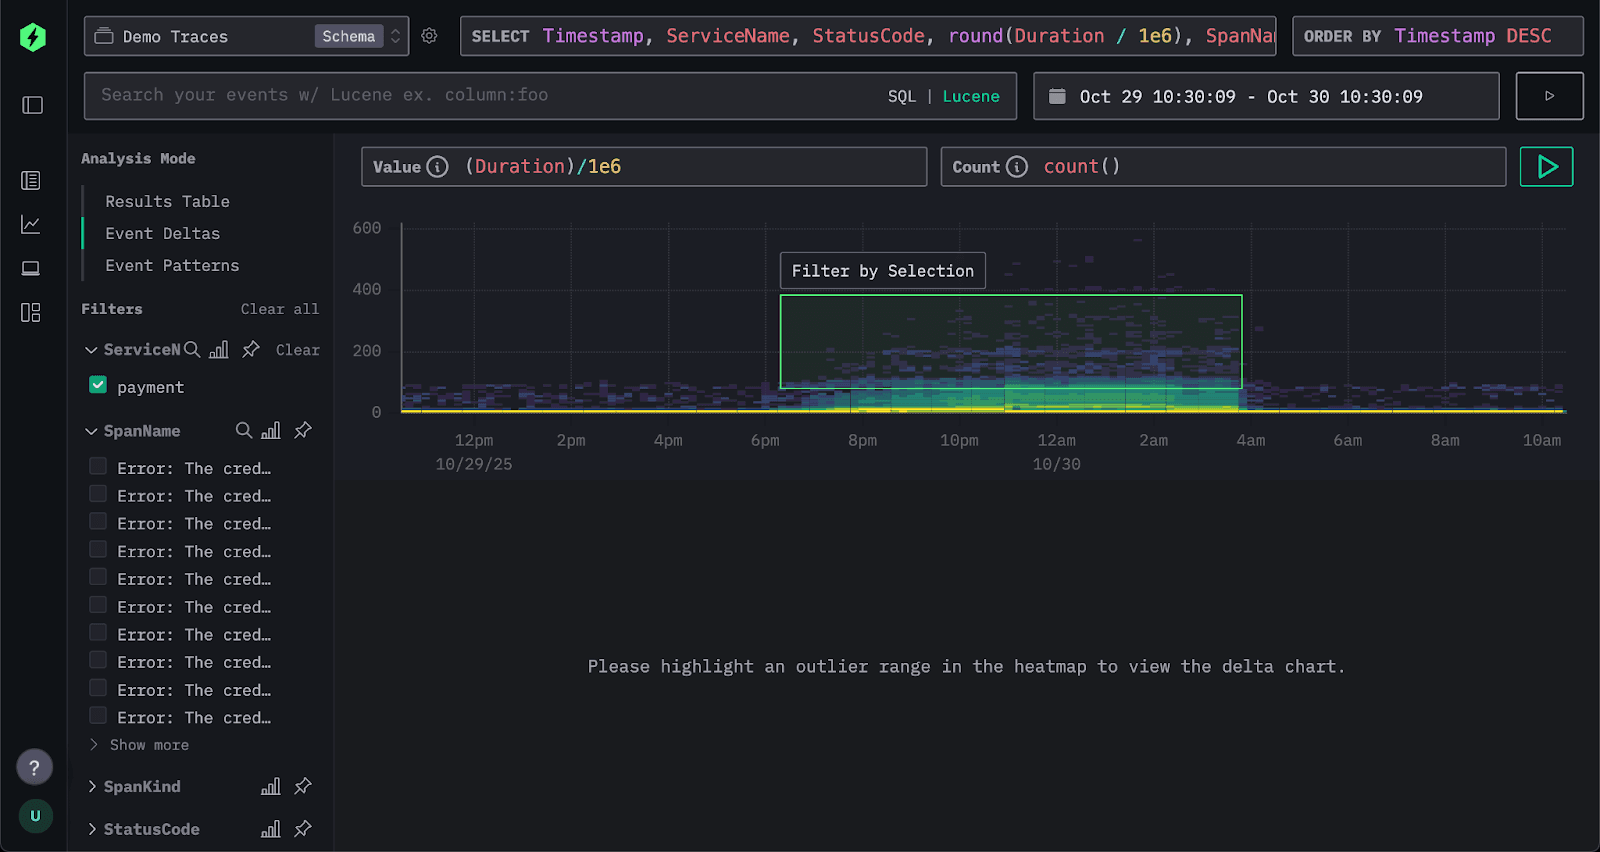
For each attribute, ClickStack identifies values that are disproportionately represented in the selected outlier subset. In other words, if a value appears far more often in the slower spans than in the overall dataset, it’s highlighted as significant. Beneath the density plot, ClickStack renders a series of bar charts - one for each attribute, showing the distribution of values across the selected subsets. Attributes with the strongest bias are listed first, surfacing the factors most closely associated with anomalous spans and distinguishing them from normal behavior.
Event Deltas work by issuing two queries: one for the selected outlier area and one for the inlier area. Each query is limited to the appropriate duration and time window. A sample of events from both result sets is then inspected, and columns for which a high concentration of values appears predominantly in the outliers are identified. If interested in the queries, you can open your browser devtools to see the queries being issued.
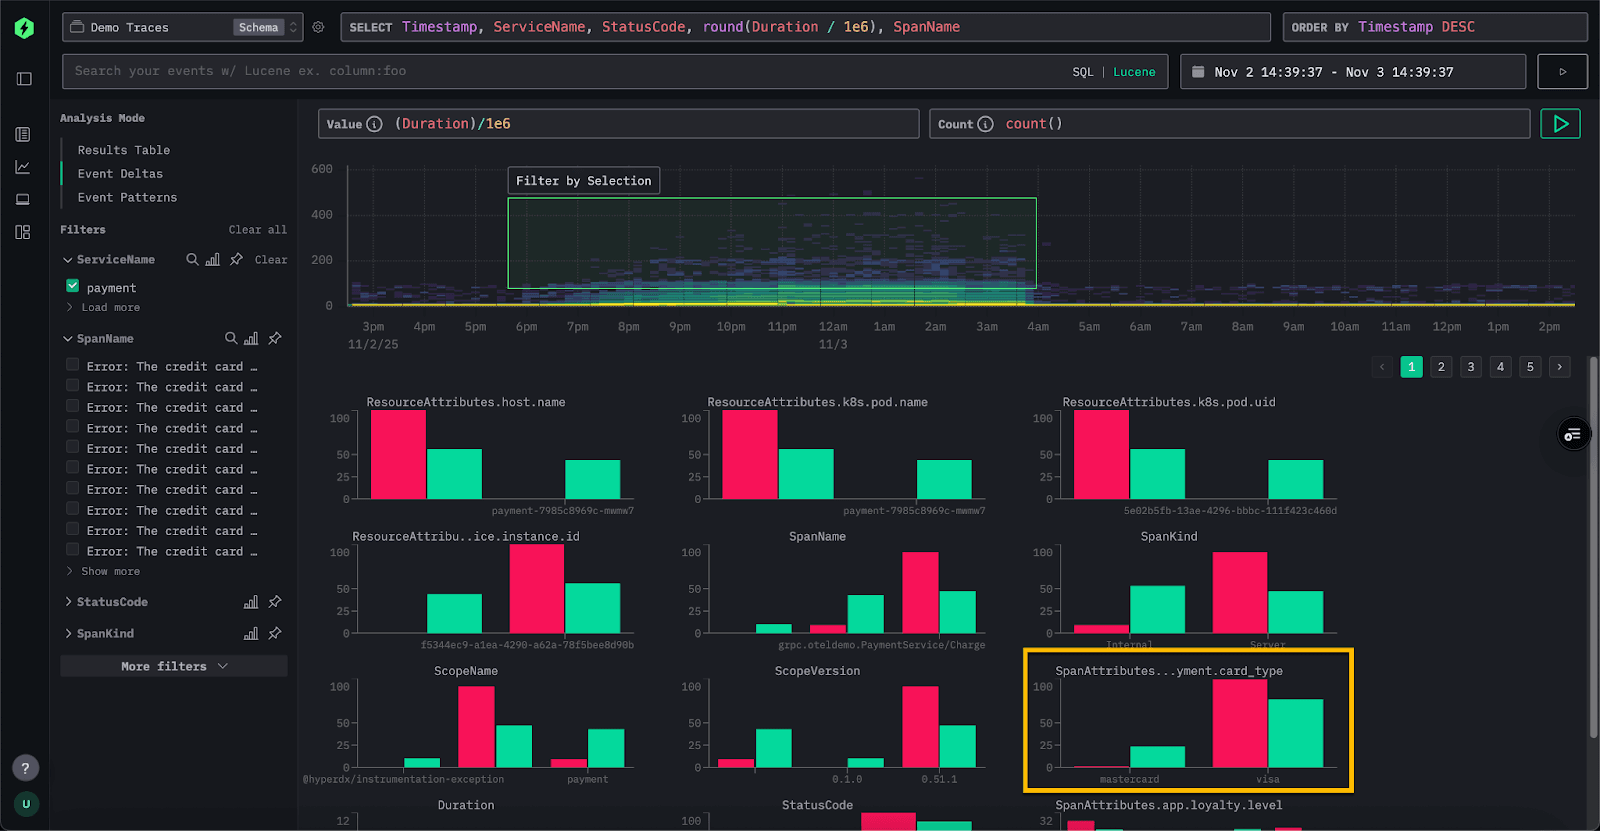
In the example above, the SpanAttributes.app.payment.card_type field has surfaced. The Event Delta's analysis reveals that 24% of inliers use MasterCard, while only 1% of outliers do. Conversely, 99% of the outliers use Visa, compared to 70% of the inliers. This indicates that the Visa card type is strongly correlated with the higher-latency traces, while MasterCard appears only in the normal subset.
Conversely, values that appear only in the inliers can also provide useful insights. In this example, the error “Visa. Cache full” value appears exclusively in the inlier spans and is entirely absent from the outliers. Whenever this error occurs, latency remains below roughly 50 milliseconds, suggesting that this condition is actually linked to faster responses rather than elevated latency.
We can use this information to dig deeper, filtering to these event subsets in the Traces view and examining specific traces to confirm the hypothesis.
Importantly, Event Deltas integrate naturally into existing exploratory workflows. They do not replace the usual investigation process but serve as an additional tool for SREs and developers to accelerate analysis and pinpoint issues more efficiently.
How to best make use of Event Deltas #
Event Deltas are a powerful tool for SREs exploring observability data, but like any analytical method, their effectiveness depends on how they are used. To get the most value, it helps to apply a few simple best practices.
Focus on a single service #
Event Deltas produce the best results when analysis is limited to one service at a time. Latency can vary significantly across services, which makes it harder to identify which attributes truly correlate with outliers. For example, the following is challenging for Event Deltas to analyze:
Before enabling Event Deltas, filter spans to a set where latency distributions are expected to be similar - often a single service. You’ll get clearer, more meaningful results by targeting areas where wide variation is unusual rather than expected.
Select a clean subset for comparison #
When defining an area of interest, aim for a clear separation between faster and slower spans. This allows Event Deltas to more accurately distinguish which attributes are driving the performance difference.
Ensure sufficient sample size #
For meaningful comparisons, make sure both the inlier and outlier groups contain enough spans to reflect real patterns rather than random noise. Very small samples can exaggerate correlations or produce misleading results, while larger, well-balanced subsets help Event Deltas surface truly significant attributes and trends.
Recent improvements - more flexibility #
Until recently, Event Deltas were limited to analyzing traces using the Duration column on the y-axis, with color intensity based on count i.e. number in the bucket. In most cases, this remains the most effective way to visualize performance data. However, based on user feedback, we added the ability to customize both the y-axis and the color intensity metric, providing more flexibility for advanced analysis.
While this is an advanced feature, several use cases have already emerged. A common scenario involves traces that include additional latency-related columns beyond the standard span duration. For example, in our public ClickPy demo, which provides analytics for Python packages and includes over 2 trillion rows, OpenTelemetry tracing is used to capture and debug user issues.
Each chart in the application issues multiple queries to ClickHouse. While the overall request duration is captured in the duration column, we are often more interested in the ClickHouse response time itself. High response times might indicate temporary load on the system, but they could also highlight specific queries that consistently run slower.
The field db.response_time_ms within the SpanAttributes map stores the query response time. We can now adjust the value column for Event Deltas directly by modifying the expression above the density heatmap. To analyze this String value we cast it to a UInt64, allowing Event Deltas to analyze response time instead of span duration.
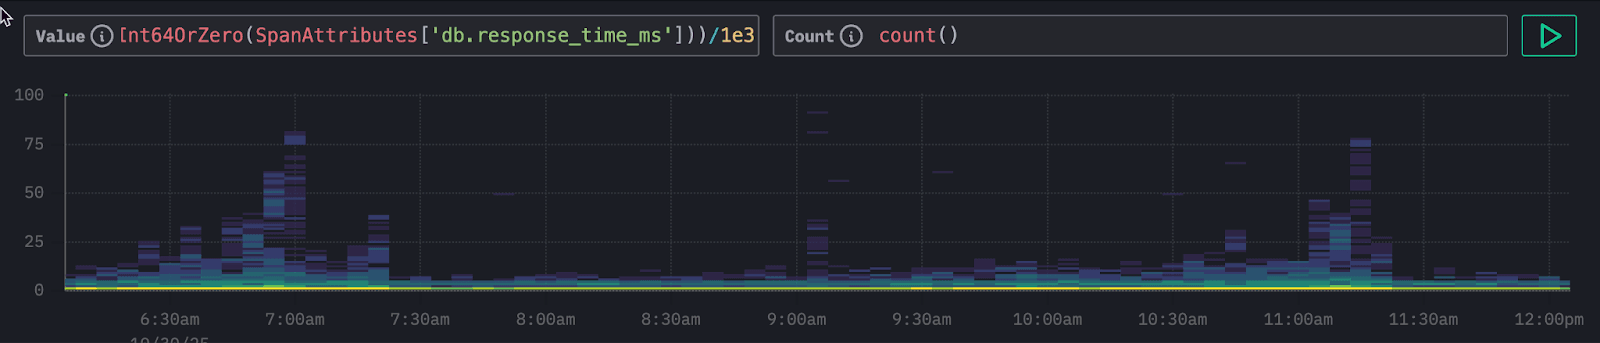
In the resulting visualization, we can clearly see periodic clusters of higher latencies. As before, we can select these regions to perform an Event Delta's analysis and identify which attributes are contributing to this pattern.
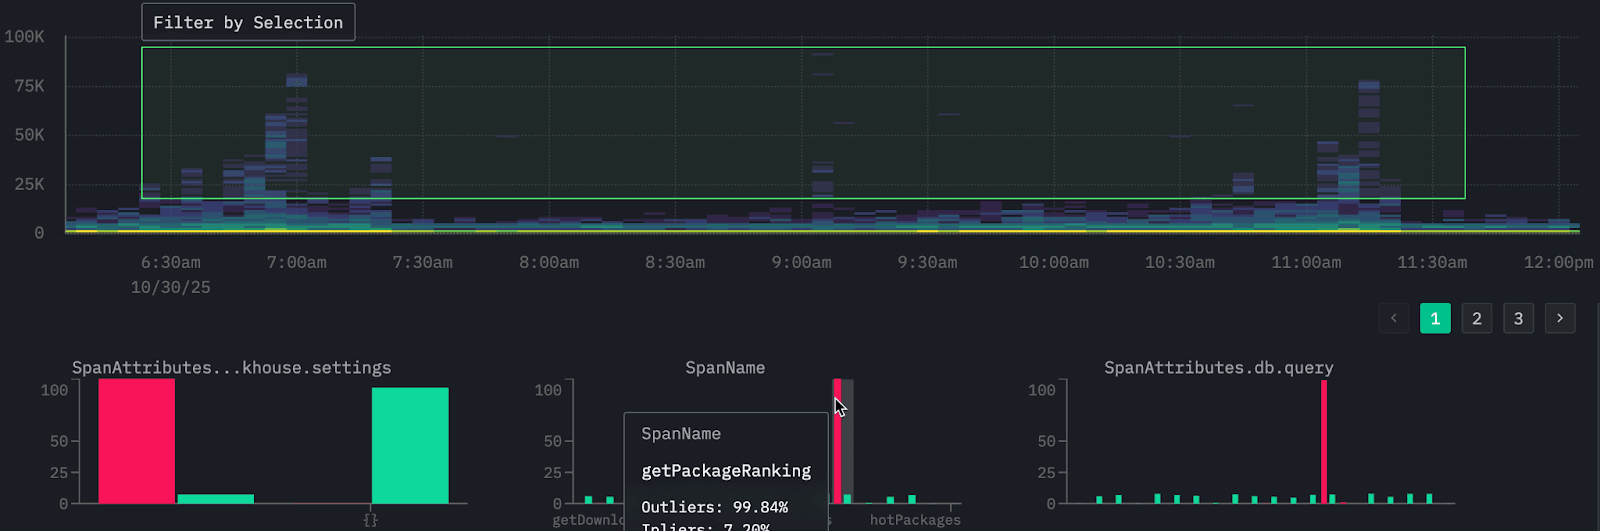
From our analysis we can clearly see it's one specific type of query that is causing these high latencies connected to the visual getPackageRanking - this computes how a package ranks within the Python ecosystem for total downloads.
While count-based color intensity is the default and most intuitive way to visualize spans, other aggregate metrics can reveal different dimensions of performance if used to determine the density. Using fields such as status_code, request_size_bytes, cpu_time_ms, or query_cost for color intensity can highlight error frequency, payload size, resource usage, or query complexity in relation to latency. Choosing the right metric allows Event Deltas to move beyond raw counts and uncover deeper correlations within trace data.
Important, the color intensity column must be an aggregation function. For example,
avg,sum,max,quantileor even custom expressions such ascountDistinct(field).
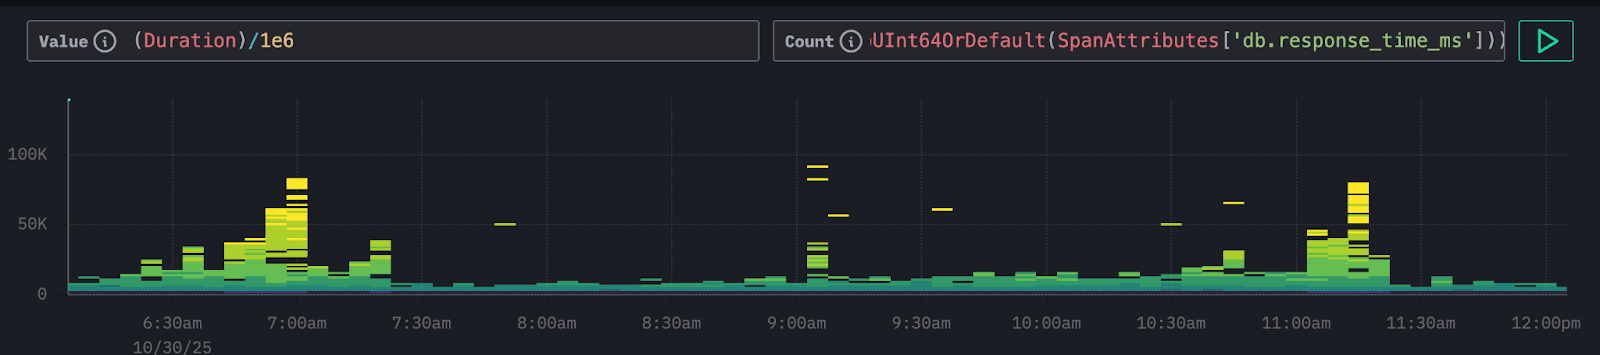
In this example, we analyze ClickPy spans to see whether overall span duration (the time it takes for visualizations to load) correlates with database response time. Using Duration on the y-axis and db.response_time_ms for color intensity quickly reveals that slower visualizations align with higher database latency, shown by stronger intensity in upper buckets. This points to the database as the likely source of slowdown, allowing us to focus analysis on specific queries rather than unrelated causes.
Conclusion #
In this post, we’ve explored the motivation behind Event Deltas, the problem they solve, and how they provide a faster, more intuitive way to identify the root causes of performance regressions in observability data. We covered how to use them effectively, outlined best practices for analysis, and highlighted recent improvements that make them more flexible than ever. Event Deltas are a useful tool in SRE’s investigation workflow - helping teams move quickly from identifying outliers to understanding why they occur and taking action to resolve them.


