Get started with ClickHouse Cloud today and receive $300 in credits. To learn more about our volume-based discounts, contact us or visit our pricing page.
Today, we're excited to announce that ClickHouse Cloud now supports enhanced monitoring with Prometheus. This feature is generally available and makes monitoring cloud instances easier than ever, meeting users where they are and allowing them to use their preferred tooling for observability.
The popular feature request addresses a requirement that many organizations have when adopting a Cloud service - the ability to monitor its uptime and performance independently of ClickHouse itself.
Users wishing to try this feature should visit our documentation. We’ve provided simple examples in our docs for users looking to learn how to integrate with Datadog and Grafana.
If you're interested in learning more about the benefits of using the Prometheus API over existing approaches, as well as some of the challenges in implementing it efficiently, read on.
Background & challenges #
The ability to centrally monitor the Cloud service on which they depend is critical for organizations. Historically, users wanting to monitor ClickHouse Cloud would rely on querying system tables for the metrics they needed. This represented friction for many infrastructure engineers who would need to explore and extract metrics from system tables using SQL. Even if proficient in SQL, in many cases, constructing the correct queries in ClickHouse and finding the appropriate system table could be time-consuming. This doesn’t also consider the need to configure appropriate access controls and permissions for the agent.
While agents, such as Datadog, can be used to monitor ClickHouse Cloud, these typically came with limitations - specifically in the case of Datadog, the routing by our Cloud proxy layer would mean the same instances would not be queried across invocations making the subsequent metrics challenging to interpret. This could be overcome with some careful configuration and use of the clusterAllReplicas function, these integrations would also suffer a common problem: their continued polling for metrics via SELECT queries would mean instances would never idle.
Given that our users rely on the ability of ClickHouse Cloud instances to idle when not used, thus minimizing compute costs, this behavior, which coupled with monitoring usage, was highly undesirable and a blocker for many users.
Finally, the Prometheus format is now almost a standard for this form of data and is supported by popular tools such as Grafana and Datadog with out-of-box integrations.
A simple endpoint that delivered Prometheus metrics for an instance without preventing unused instances from idling or waking up was clearly the preferred solution.
A simple and elegant design #
Any endpoint thus had some quite simple requirements:
- Deliver metrics in Prometheus format - compatible with existing commonly used monitoring agents.
- No waking of idling instances - these should just return a simple message denoting their state.
- Not prevent instances from idling - requests to this endpoint should not be considered when determining whether an instance should be idled.
While we could have possibly delivered this capability through configuration for each ClickHouse instance, e.g. using the existing ability to configure a Prometheus endpoint in ClickHouse, this represented an imperfect solution for our users. Ensuring these requests were not forwarded when an instance was idle was technically not elegant to implement. Furthermore, it meant users would need to create a user with appropriate roles and permissions for each instance and distribute these credentials to their agent. For many organizations, this would represent a security risk and seem unnecessarily complicated.
The logical place for this endpoint to sit was our existing Cloud API. This API already allows users to create and configure instances. Furthermore, it provides an organizational-level access control where users can create (and revoke!) API keys with a few clicks. By exposing this endpoint through the Cloud API, we could minimize the security attack surface and provide a simple-to-use endpoint that requires no knowledge of ClickHouse or SQL!
We have, therefore, provided a single simple Cloud API endpoint where users can securely request Prometheus metrics for a specific organization and instance.
API keys are organization level and can be defined as either "Developer" or "Admin". Developer access permissions are sufficient for the Prometheus endpoints, ensuring compromise credentials do not allow services to be created or disrupted.
Implementation #
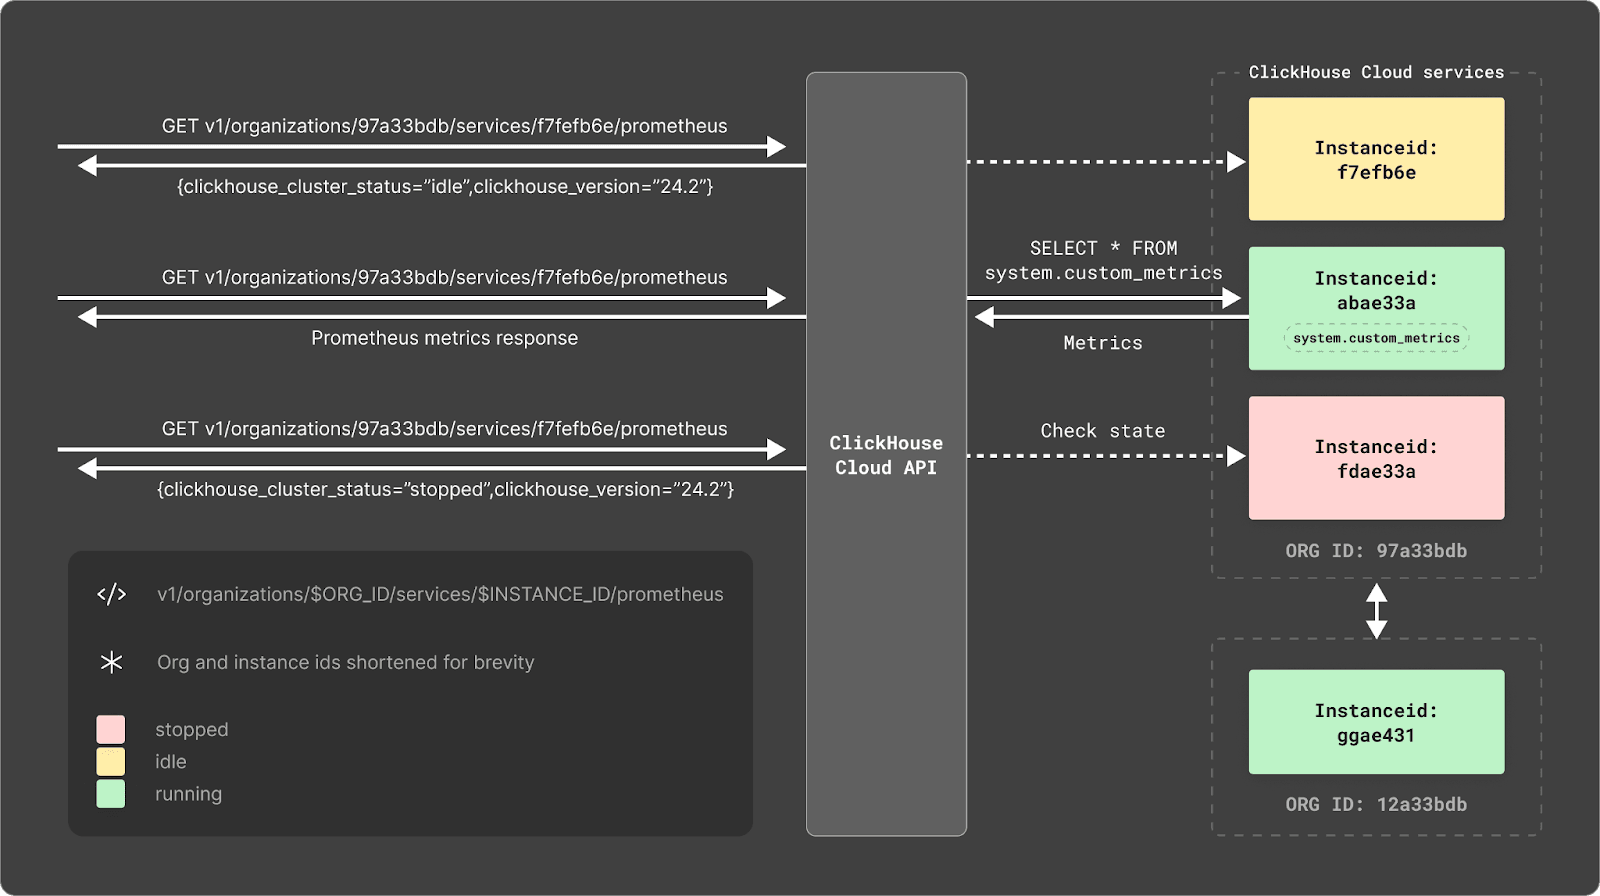
The decision to implement the endpoint through the Cloud API meant the implementation remained simple. The Cloud API is already aware of the state of each instance, allowing it to not issue the request to idling instances. Assuming the instance is running, the request is made using a specific user with limited permission scope. The requests from this user are subsequently ignored by the data plane when considering whether to idle instances.
Efficient metric collection #
This just left the appropriate query for the system tables to be formulated. Given that the metrics we expected users would be interested in collecting were spread across many system tables, the resulting query is quite complex and has an appreciable overhead. To avoid issuing this query on every request to the endpoint, we exploit a recently released ClickHouse feature: Refreshable Materialized Views.
This view periodically (currently every minute) executes the query, sending the results to a target table system.custom_metrics, and atomically its current rows. This target table, which contains only the result set, uses the Memory engine and can be efficiently queried by the Cloud API. For the curious reader, we show the table and a sample of the view below:
CREATE TABLE system.custom_metrics
(
	`name` String,
	`value` Float64,
	`help` String,
	`labels` Map(String, String),
	`type` String
)
ENGINE = Memory
CREATE MATERIALIZED VIEW system.custom_metrics_refresher
REFRESH EVERY 1 MINUTE TO system.custom_metrics
(
	`name` String,
	`value` Nullable(Float64),
	`help` String,
	`labels` Map(String, String),
	`type` String
)
AS SELECT
	concat('ClickHouse_', event) AS name,
	toFloat64(value) AS value,
	description AS help,
	map('hostname', hostName(), 'table', 'system.events') AS labels,
	'counter' AS type
FROM system.events
UNION ALL
//other metrics
With this approach the refresh rate of the materialized view controls how often the query is executed, ensuring it is run at most once every 60s by default. This also prevents a rogue or misconfigured agent(s) from exerting query pressure on the service and waiting compute resources.
Using the endpoint #
To use the endpoint, you'll first need to create an API key in ClickHouse Cloud. This process is shown below:
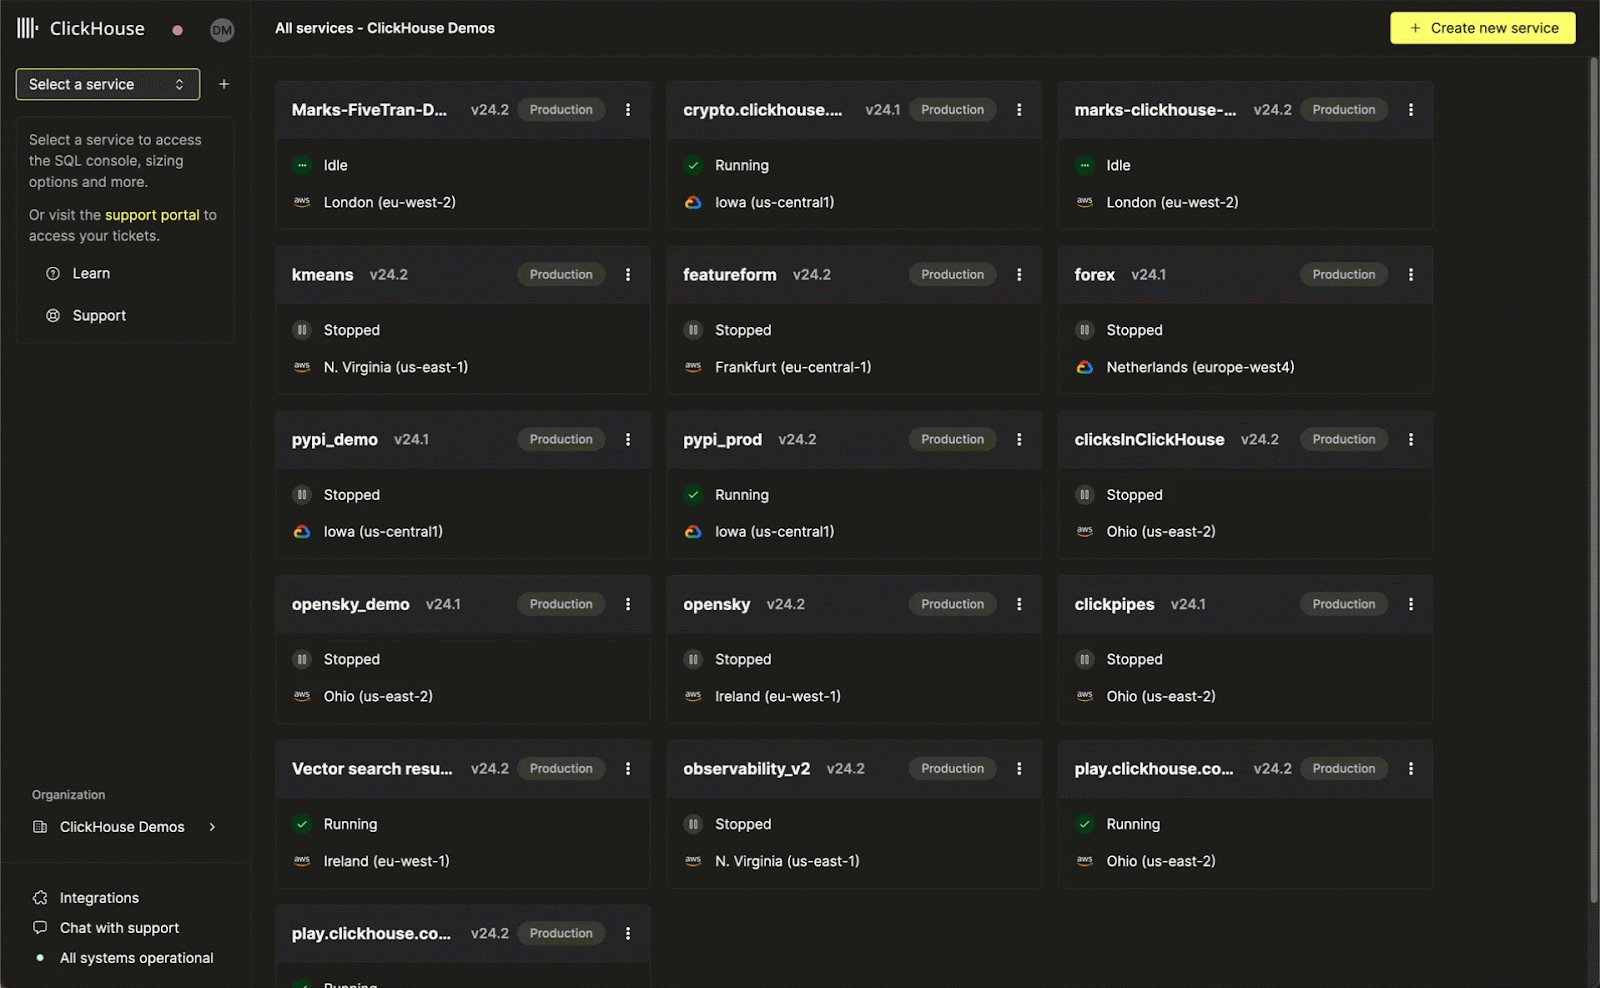
With the endpoint available, querying the endpoint requires us to obtain the organization and instance id.
With these, you can issue a simple HTTP request:
export KEY_SECRET=<key_secret>
export KEY_ID=<key_id>
export ORG_ID=<org id>
export INSTANCE_ID=<instance id>
curl --silent --user $KEY_ID:$KEY_SECRET https://api.control-plane.clickhouse-staging.com/v1/organizations/$ORG_ID/services/$INSTANCE_ID/prometheus

…
# HELP ClickHouse_ServiceInfo Information about service, including cluster status and ClickHouse version
# TYPE ClickHouse_ServiceInfo untyped
ClickHouse_ServiceInfo{clickhouse_org="c2ba4799-a76e-456f-a71a-b021b1fafe60",clickhouse_service="12f4a114-9746-4a75-9ce5-161ec3a73c4c",clickhouse_service_name="test service",clickhouse_cluster_status="running",clickhouse_version="24.5",scrape="full"} 1

# HELP ClickHouseProfileEvents_Query Number of queries to be interpreted and potentially executed. Does not include queries that failed to parse or were rejected due to AST size limits, quota limits or limits on the number of simultaneously running queries. May include internal queries initiated by ClickHouse itself. Does not count subqueries.
# TYPE ClickHouseProfileEvents_Query counter
ClickHouseProfileEvents_Query{clickhouse_org="c2ba4799-a76e-456f-a71a-b021b1fafe60",clickhouse_service="12f4a114-9746-4a75-9ce5-161ec3a73c4c",clickhouse_service_name="test service",hostname="c-cream-ma-20-server-3vd2ehh-0",instance="c-cream-ma-20-server-3vd2ehh-0",table="system.events"} 6

# HELP ClickHouseProfileEvents_QueriesWithSubqueries Count queries with all subqueries
# TYPE ClickHouseProfileEvents_QueriesWithSubqueries counter
ClickHouseProfileEvents_QueriesWithSubqueries{clickhouse_org="c2ba4799-a76e-456f-a71a-b021b1fafe60",clickhouse_service="12f4a114-9746-4a75-9ce5-161ec3a73c4c",clickhouse_service_name="test service",hostname="c-cream-ma-20-server-3vd2ehh-0",instance="c-cream-ma-20-server-3vd2ehh-0",table="system.events"} 230

# HELP ClickHouseProfileEvents_SelectQueriesWithSubqueries Count SELECT queries with all subqueries
# TYPE ClickHouseProfileEvents_SelectQueriesWithSubqueries counter
ClickHouseProfileEvents_SelectQueriesWithSubqueries{clickhouse_org="c2ba4799-a76e-456f-a71a-b021b1fafe60",clickhouse_service="12f4a114-9746-4a75-9ce5-161ec3a73c4c",clickhouse_service_name="test service",hostname="c-cream-ma-20-server-3vd2ehh-0",instance="c-cream-ma-20-server-3vd2ehh-0",table="system.events"} 224

# HELP ClickHouseProfileEvents_FileOpen Number of files opened.
# TYPE ClickHouseProfileEvents_FileOpen counter
ClickHouseProfileEvents_FileOpen{clickhouse_org="c2ba4799-a76e-456f-a71a-b021b1fafe60",clickhouse_service="12f4a114-9746-4a75-9ce5-161ec3a73c4c",clickhouse_service_name="test service",hostname="c-cream-ma-20-server-3vd2ehh-0",instance="c-cream-ma-20-server-3vd2ehh-0",table="system.events"} 4157

# HELP ClickHouseProfileEvents_Seek Number of times the 'lseek' function was called.
# TYPE ClickHouseProfileEvents_Seek counter
ClickHouseProfileEvents_Seek{clickhouse_org="c2ba4799-a76e-456f-a71a-b021b1fafe60",clickhouse_service="12f4a114-9746-4a75-9ce5-161ec3a73c4c",clickhouse_service_name="test service",hostname="c-cream-ma-20-server-3vd2ehh-0",instance="c-cream-ma-20-server-3vd2ehh-0",table="system.events"} 1840
…
ClickHouse Cloud Prometheus endpoint exposes the same set of metrics as the native ClickHouse Prometheus endpoint. The above represents a small sample of the metrics collected - we currently expose over 1000 metrics that we have found useful for monitoring ClickHouse. You can check what metrics are exposed in ClickHouse documentation.
Please let us know if there is a metric we’re missing that you need to monitor ClickHouse Cloud!
If the instance is idle, the response indicates as such:
# HELP ClickHouse_ServiceInfo Information about service, including cluster status and ClickHouse version
# TYPE ClickHouse_ServiceInfo untyped
ClickHouse_ServiceInfo{clickhouse_org="c2ba4799-a76e-456f-a71a-b021b1fafe60",clickhouse_service="12f4a114-9746-4a75-9ce5-161ec3a73c4c",clickhouse_service_name="test service",clickhouse_cluster_status="idle",clickhouse_version="24.5",scrape="full"}
Prometheus example #
To install the Prometheus, you can follow the official Prometheus guide.
Below is a simple example of how you can configure a Prometheus scraping job for the ClickHouse Cloud. You'll need <ORG_ID>, <INSTANCE_ID>, <KEY_ID> and <KEY_SECRET> from the steps above. Note the honor_labels configuration parameter. It needs to be set in true for the instance label to be properly populated.
global:
  scrape_interval: 15s
scrape_configs:
  - job_name: "prometheus"
    static_configs:
    - targets: ["localhost:9090"]
  - job_name: "clickhouse"
    static_configs:
      - targets: ["api.clickhouse.cloud"]
    scheme: https
    metrics_path: "/v1/organizations/<ORG_ID>/services/<INSTANCE_ID>/prometheus"
    basic_auth:
      username: <KEY_ID>
      password: <KEY_SECRET>
    honor_labels: true
Datadog example #
You can use the Datadog Agent and OpenMetrics integration to collect metrics from the ClickHouse Cloud endpoint. Below is a simple example configuration for this agent.
init_config:

instances:
   - openmetrics_endpoint: 'https://api.control-plane.clickhouse.com/v1/organizations/97a33bdb-4db3-4067-b14f-ce40f621aae1/services/f7fefb6e-41a5-48fa-9f5f-deaaa442d5d8/prometheus'
     namespace: 'clickhouse'
     metrics:
         - '^ClickHouse_.*'
     username: username
     password: password
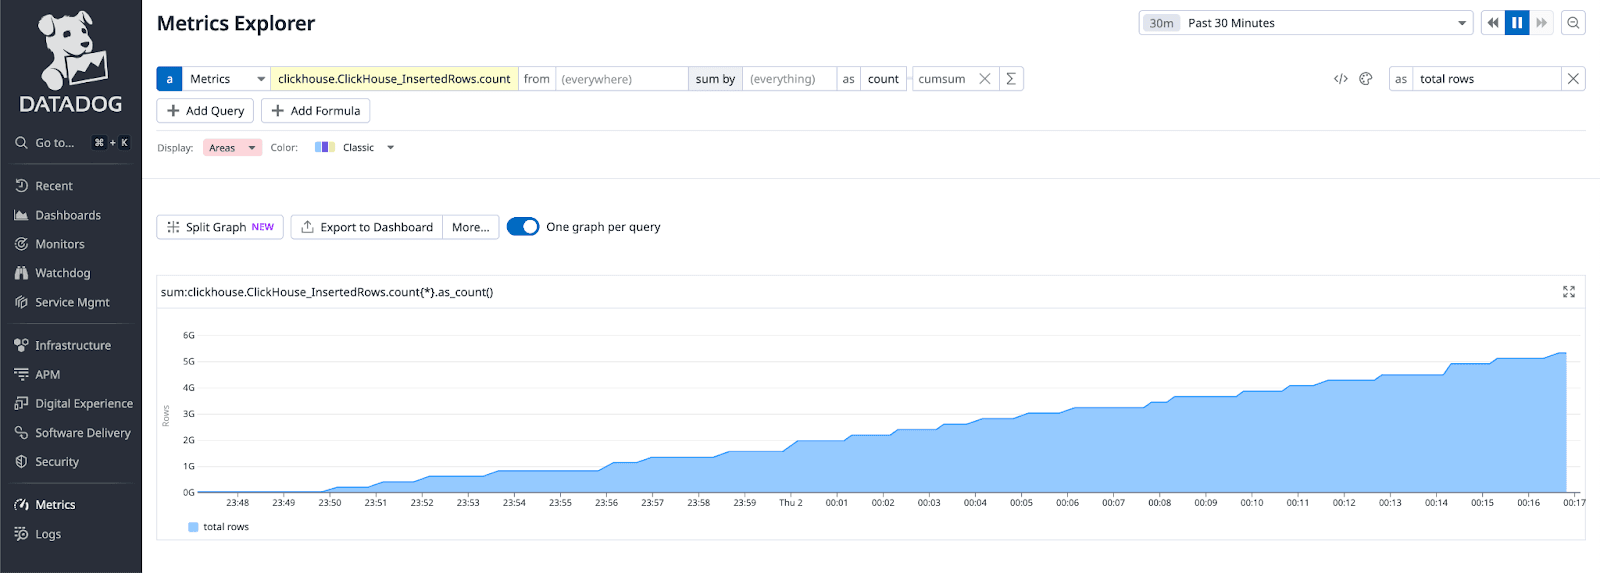
We show below the monitoring of a large insert workload for ClickHouse using metrics collected by this agent:
You can consult our documentation for a full guide on integrating with Datadog and Grafana.
Conclusion #
The release of the Prometheus integration should allow users to monitor ClickHouse Cloud with their favorite observability tools. The set of metrics represents those we have found useful in monitoring ClickHouse. We expect this set to expand, and we encourage our users to highlight any they feel are missing or other integrations if they have requirements to expand and customize these metrics!
Get started with ClickHouse Cloud today and receive $300 in credits. At the end of your 30-day trial, continue with a pay-as-you-go plan, or contact us to learn more about our volume-based discounts. Visit our pricing page for details.


