When your mission-critical workflows span days, weeks, or even months, every data observability data point counts. That's why we're excited to announce the integration between ClickStack and Temporal Cloud's OpenMetrics endpoint, bringing high performance observability to your durable execution platform.
Temporal is a durable execution platform that helps developers build reliable applications. Temporal lets you focus on business logic rather than writing complex error handling, retry logic, and state management code to survive failures.
Your business logic runs as a Temporal Workflow, whether that means processing payments, orchestrating agents, or managing long-running shopping cart experiences. If a server crashes, the network fails, or a service goes down, Temporal automatically recovers and resumes execution exactly where it left off. No lost progress, no orphaned processes.
ClickStack is a cloud-native observability stack built on ClickHouse for high-performance storage and querying of logs, metrics, and traces. It’s designed for teams dealing with large volumes of telemetry and high-cardinality data, where traditional observability platforms either fall over or become cost-prohibitive.
ClickStack focuses on horizontal scalability, efficient compression, and predictable query performance, even as data volumes grow into the petabyte range. It’s commonly used for log analytics, operational monitoring, and deep investigation of production systems where ingestion rate and retention really matter.
Get started with ClickStack
Explore the ClickHouse-powered open source observability stack built for OpenTelemetry at scale.
ClickStack consists of:
HyperDX UI, a purpose-built frontend for exploring and visualizing observability data
A custom-built OpenTelemetry Collector, with an opinionated schema for logs, metrics, and traces
ClickHouse, the high-performance analytical database at the core of the stack
Why ClickStack and Temporal Cloud belong together #
Running Temporal at scale means managing potentially thousands of concurrent workflows, each with its own activities, timers, and state transitions. When something goes wrong, or when you need to optimize performance, you need to be able to navigate the wealth of observability information coming out of the system.
This is where ClickStack helps. Built on ClickHouse, ClickStack handles the high cardinality metrics that Temporal generates with ease. ClickStack processes queries across Task Queues, Workflow Types, and Namespaces in milliseconds, so you can get to the needle in the haystack quickly.
For teams already running ClickStack, adding Temporal metrics means unified observability. Alternatively, for users running Temporal, ClickStack offers an out-of-box open-source observability solution that users can get started with in minutes. Understand how the health of a database affects Task processing backlogs. Track how deployment changes affect Workflow latency. Build dashboards that show the complete picture of your system's health.
Getting started: Connecting Temporal Cloud to ClickStack #
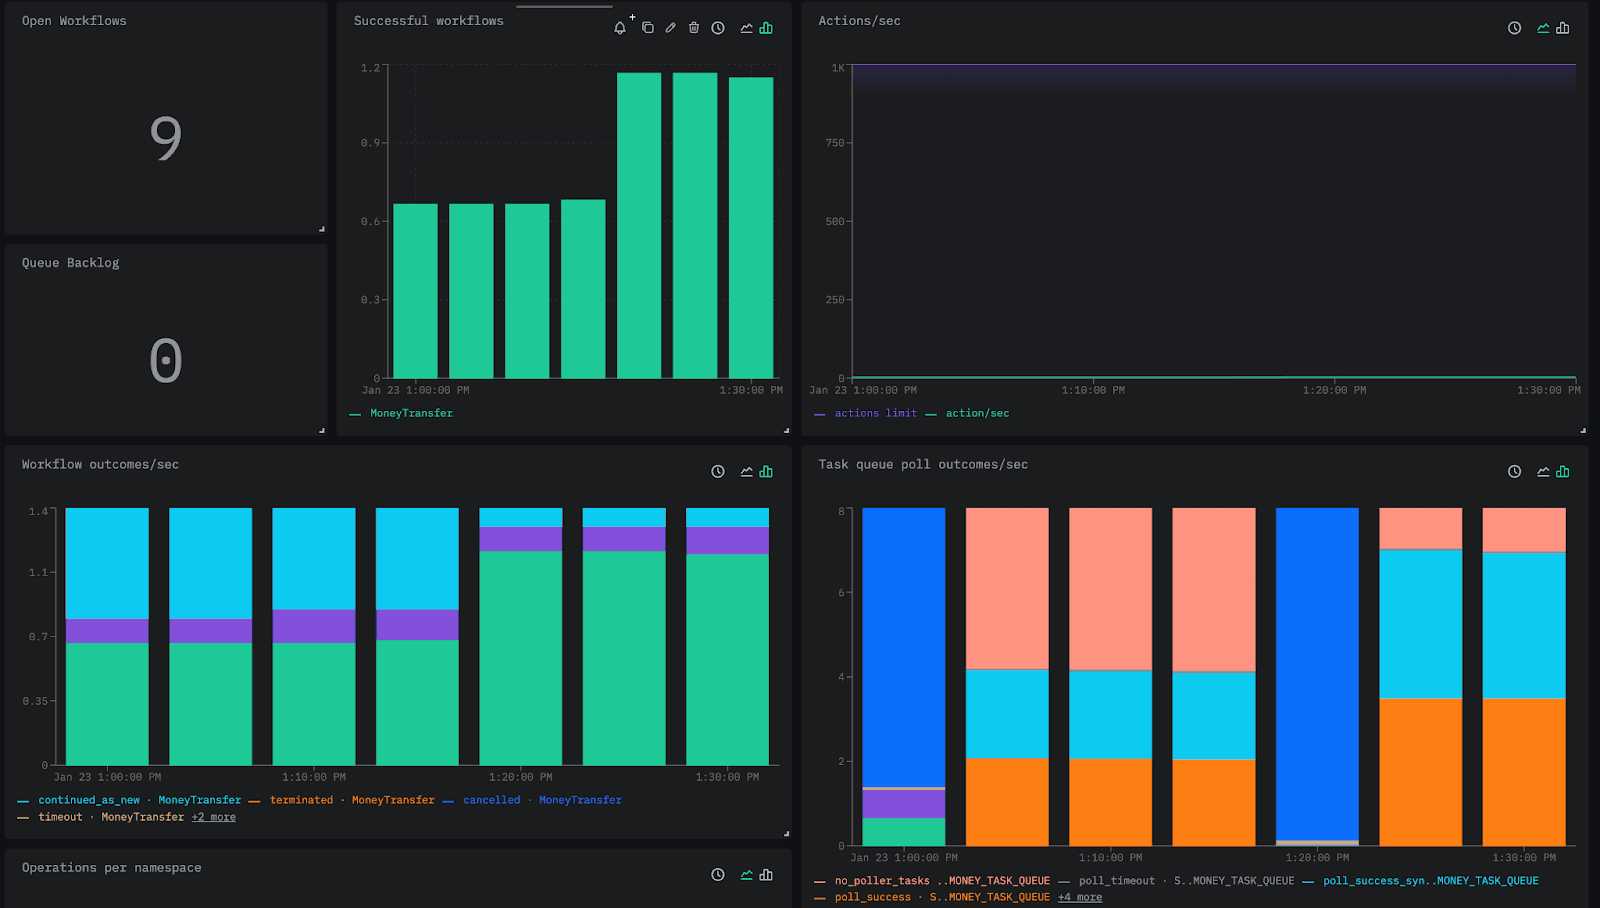
Once deployed, open the ClickStack UI, HyperDX, and navigate to the Metrics explorer. Search for metrics starting with temporal_cloud to confirm data is flowing. You can import the pre-built Temporal dashboard and immediately visualize Workflow success rates, Actions consumption against your limits, and Task Queue backlogs.
With Temporal metrics flowing into ClickStack, you can set up alerts on critical thresholds, build custom dashboards for your specific workflow patterns, and correlate workflow performance with the rest of your observability data.
For full configuration details and troubleshooting guidance, check out the complete documentation.
Your durable workflows deserve scalable observability. With ClickStack and Temporal Cloud working together, you get both.
Share this post
Subscribe to our newsletter
Stay informed on feature releases, product roadmap, support, and cloud offerings!