How ClickHouse executes a query in parallel
ClickHouse is built for speed. It executes queries in a highly parallel fashion, using all available CPU cores, distributing data across processing lanes, and often pushing hardware close to its limits.
This guide walks through how query parallelism works in ClickHouse and how you can tune or monitor it to improve performance on large workloads.
We use an aggregation query on the uk_price_paid_simple dataset to illustrate key concepts.
Step-by-step: How ClickHouse parallelizes an aggregation query
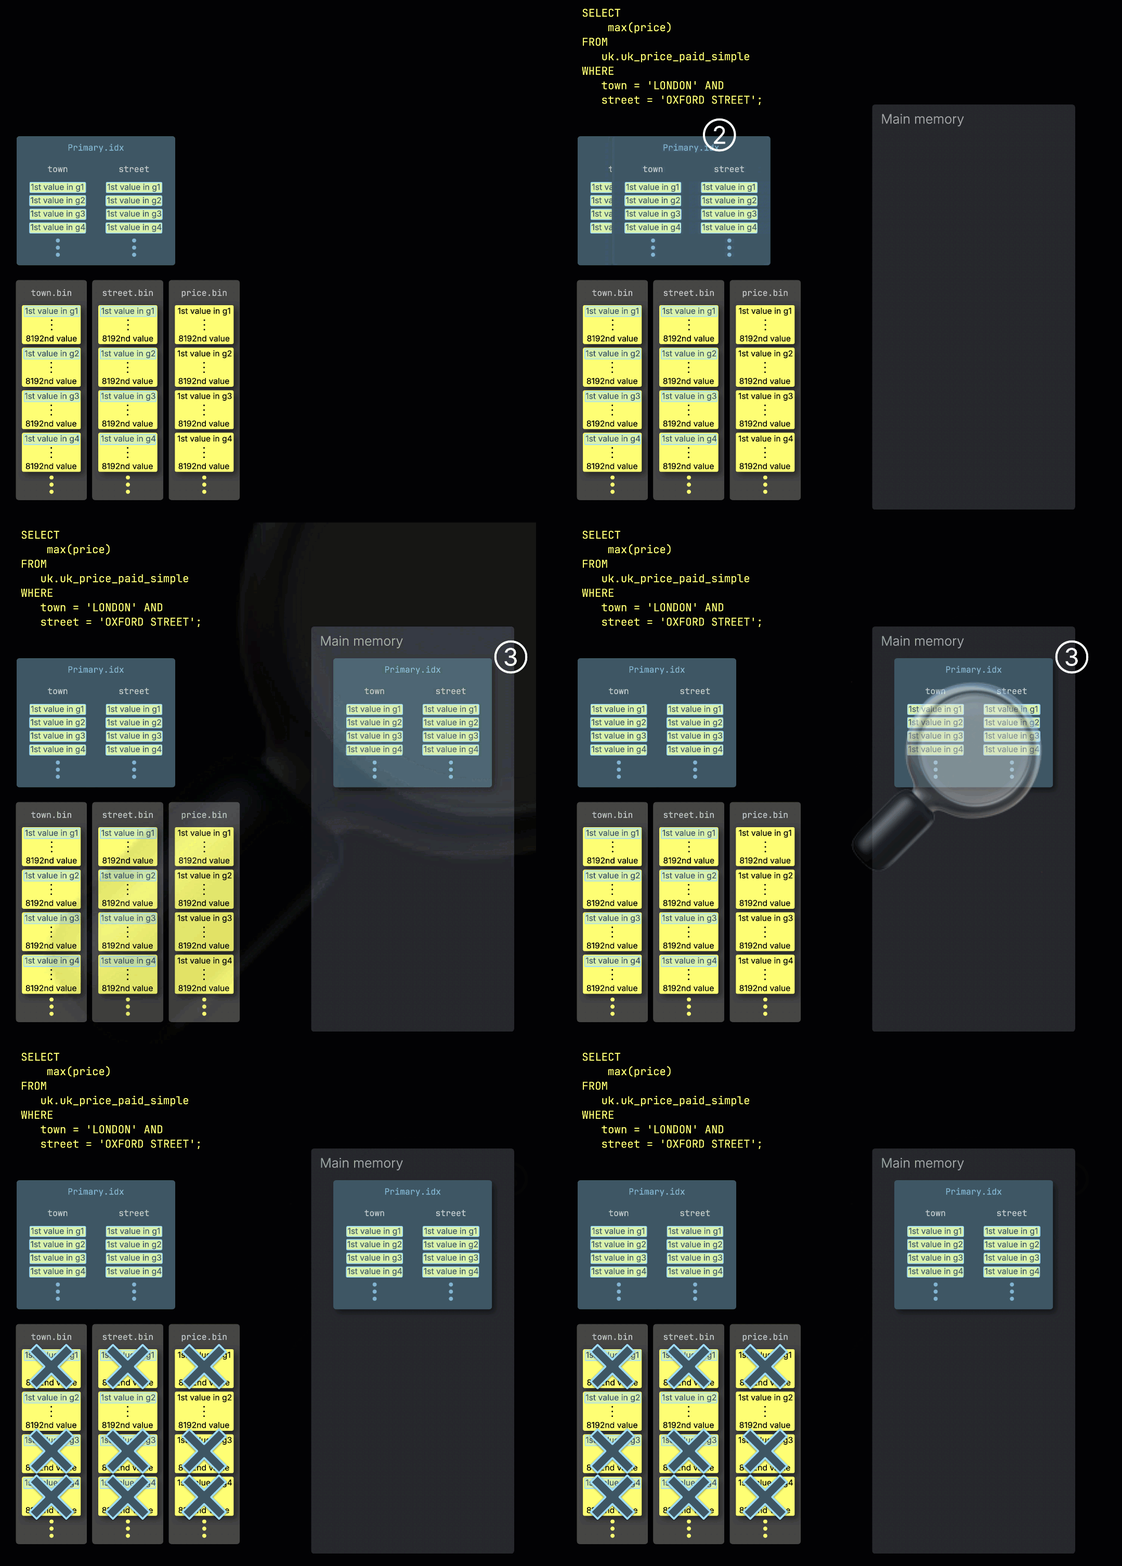
When ClickHouse ① runs an aggregation query with a filter on the table's primary key, it ② loads the primary index into memory to ③ identify which granules need to be processed, and which can be safely skipped:

Distributing work across processing lanes
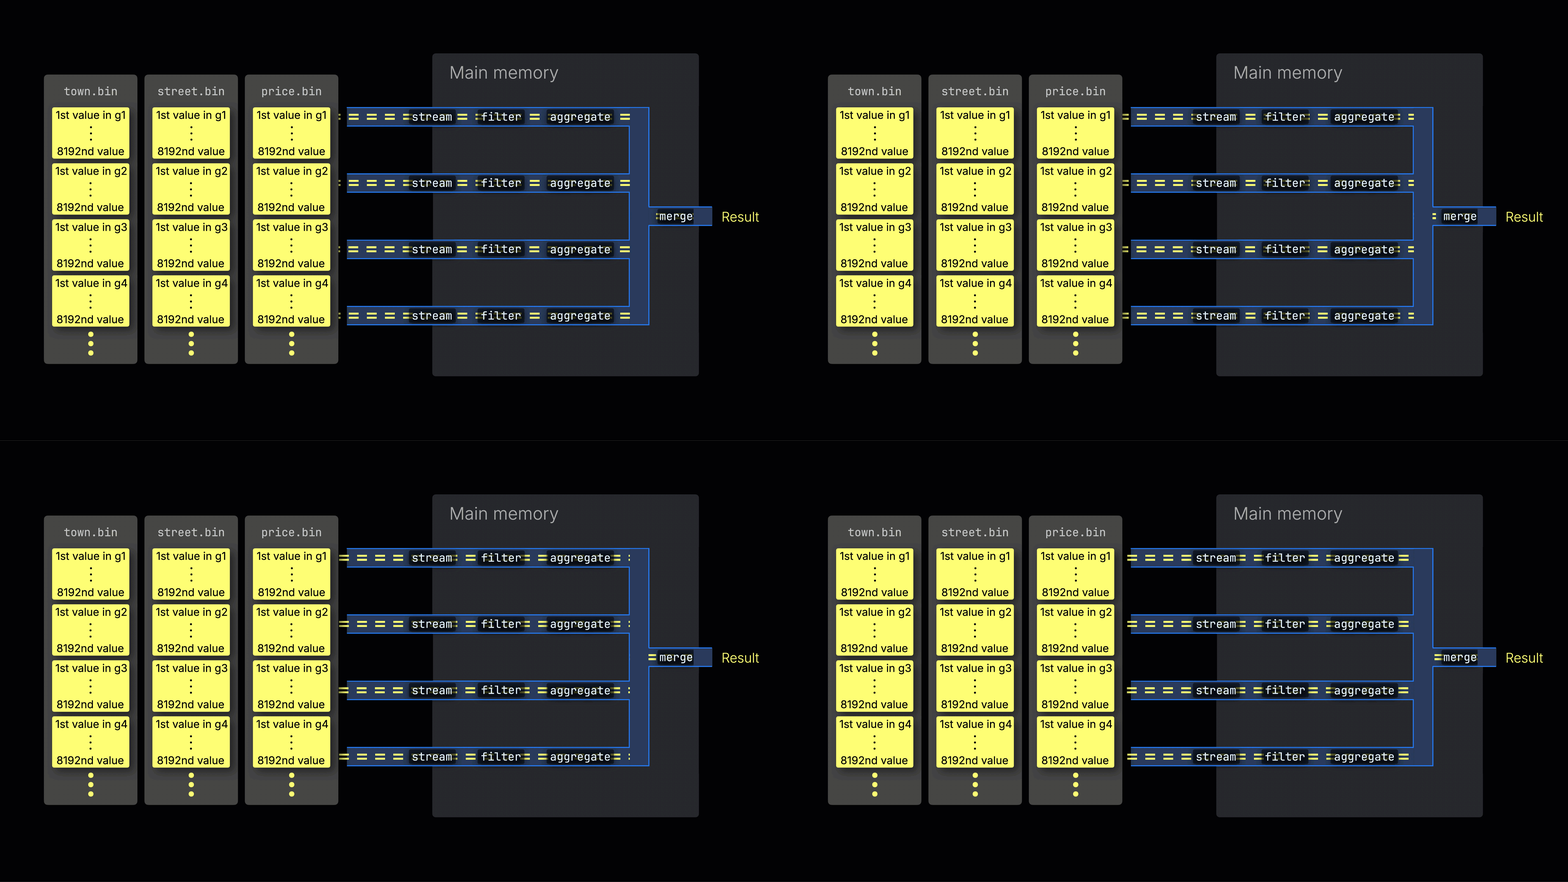
The selected data is then dynamically distributed across n parallel processing lanes, which stream and process the data block by block into the final result:

The number of n parallel processing lanes is controlled by the max_threads setting, which by default matches the number of cores (threads) of a single CPU available to ClickHouse on the server. In the example above, we assume 4 cores.
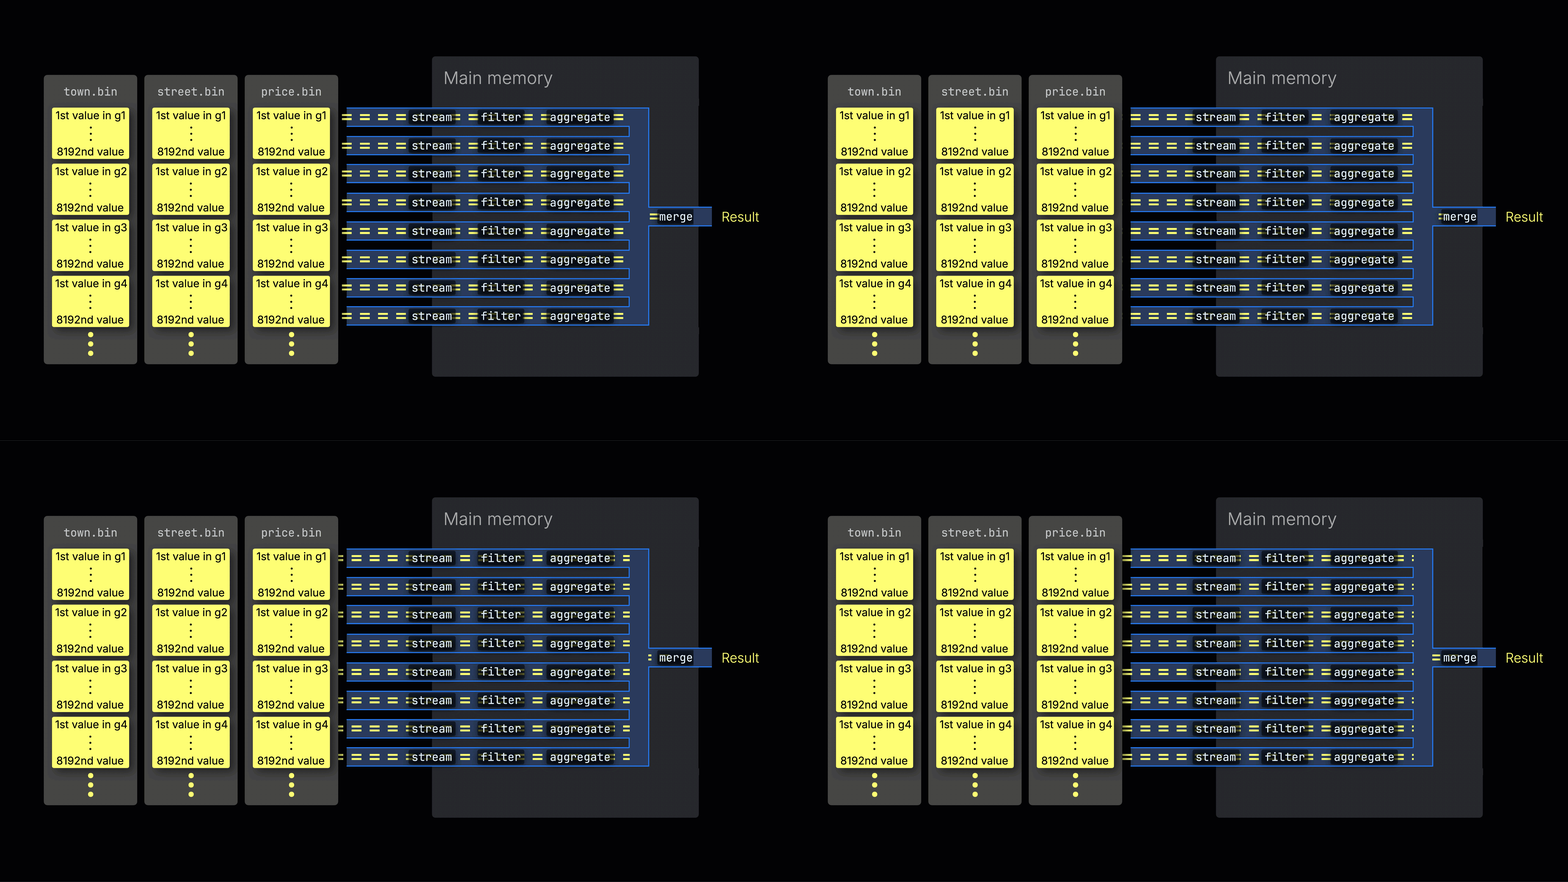
On a machine with 8 cores, query processing throughput would roughly double (but memory usage would also increase accordingly), as more lanes process data in parallel:

Efficient lane distribution is key to maximizing CPU utilization and reducing total query time.
Processing queries on sharded tables
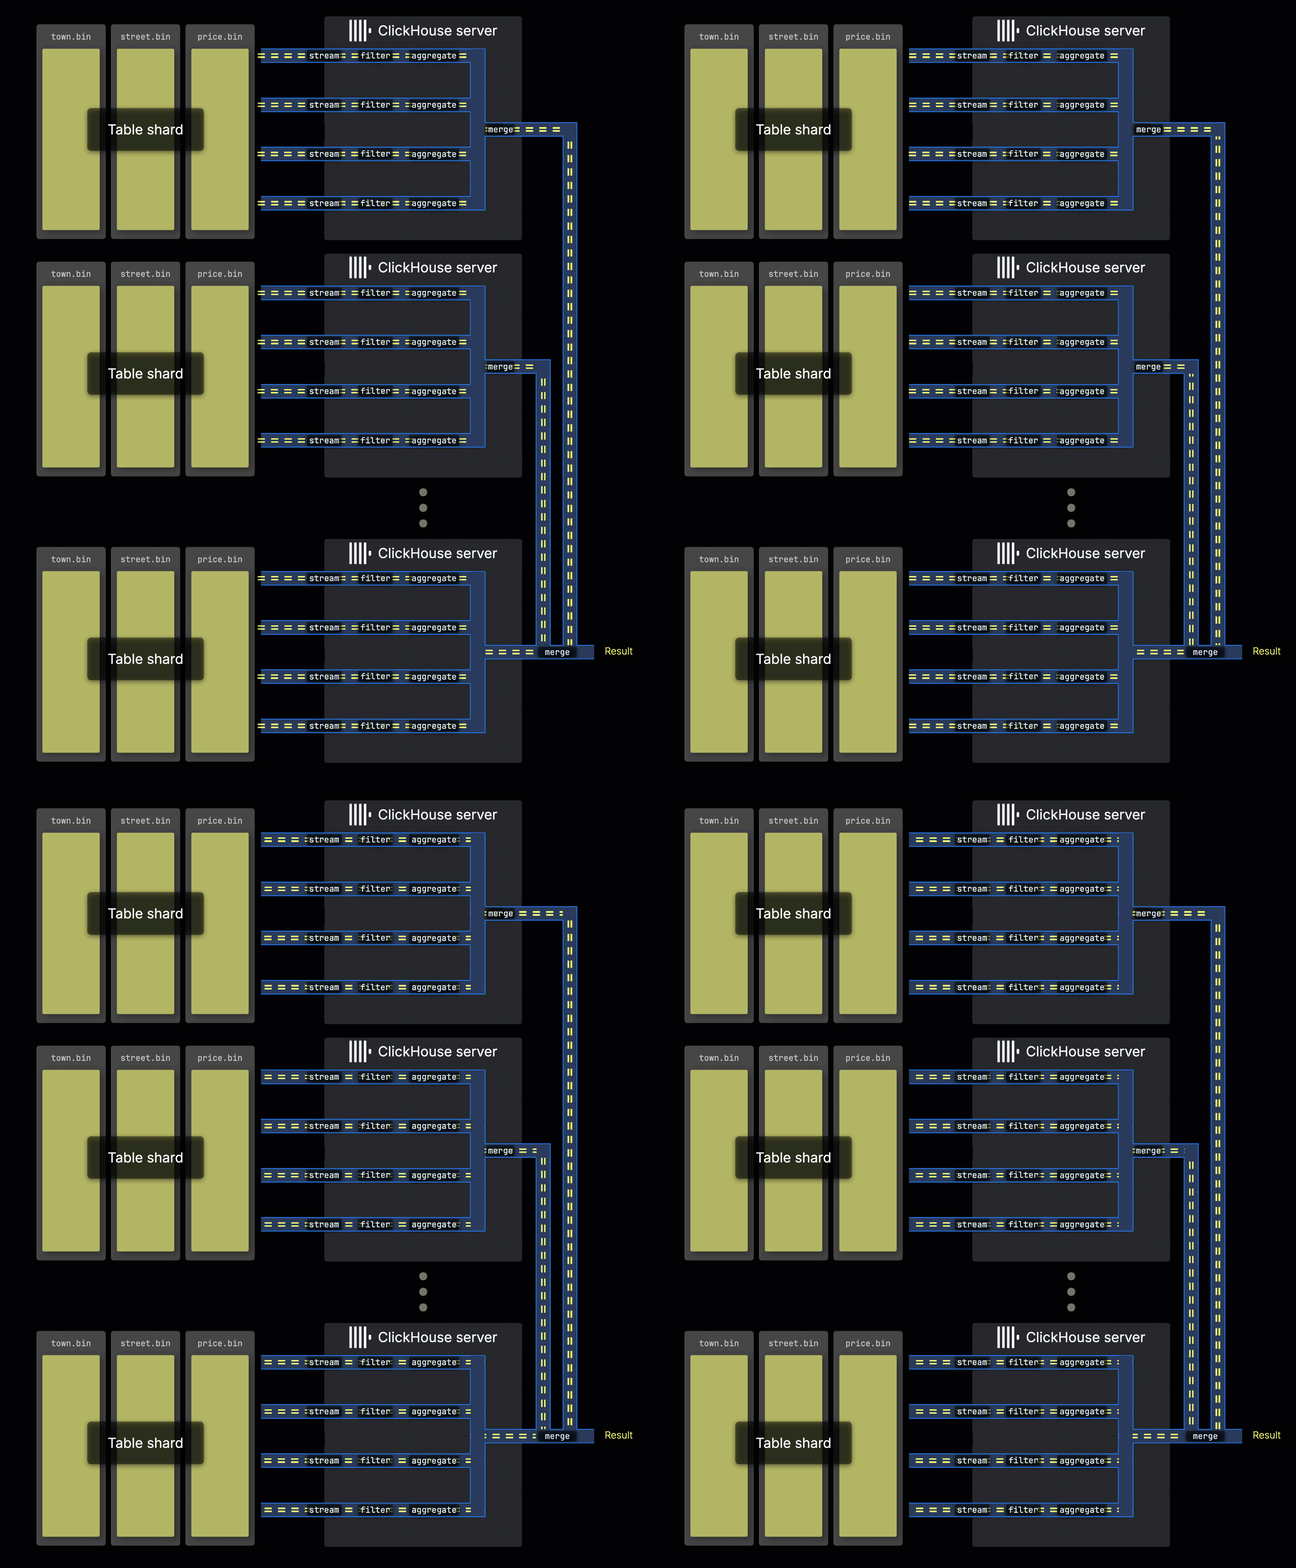
When table data is distributed across multiple servers as shards, each server processes its shard in parallel. Within each server, the local data is handled using parallel processing lanes, just as described above:

The server that initially receives the query collects all sub-results from the shards and combines them into the final global result.
Distributing query load across shards allows horizontal scaling of parallelism, especially for high-throughput environments.
In ClickHouse Cloud, this same parallelism is achieved through parallel replicas, which function similarly to shards in shared-nothing clusters. Each ClickHouse Cloud replica—a stateless compute node—processes a portion of the data in parallel and contributes to the final result, just like an independent shard would.
Monitoring query parallelism
Use these tools to verify that your query fully utilizes available CPU resources and to diagnose when it doesn't.
We're running this on a test server with 59 CPU cores, which allows ClickHouse to fully showcase its query parallelism.
To observe how the example query is executed, we can instruct the ClickHouse server to return all trace-level log entries during the aggregation query. For this demonstration, we removed the query's predicate—otherwise, only 3 granules would be processed, which isn't enough data for ClickHouse to make use of more than a few parallel processing lanes:
We can see that
- ① ClickHouse needs to read 3,609 granules (indicated as marks in the trace logs) across 3 data ranges.
- ② With 59 CPU cores, it distributes this work across 59 parallel processing streams—one per lane.
Alternatively, we can use the EXPLAIN clause to inspect the physical operator plan—also known as the "query pipeline"—for the aggregation query:
Note: Read the operator plan above from bottom to top. Each line represents a stage in the physical execution plan, starting with reading data from storage at the bottom and ending with the final processing steps at the top. Operators marked with × 59 are executed concurrently on non-overlapping data regions across 59 parallel processing lanes. This reflects the value of max_threads and illustrates how each stage of the query is parallelized across CPU cores.
ClickHouse's embedded web UI (available at the /play endpoint) can render the physical plan from above as a graphical visualization. In this example, we set max_threads to 4 to keep the visualization compact, showing just 4 parallel processing lanes:
Note: Read the visualization from left to right. Each row represents a parallel processing lane that streams data block by block, applying transformations such as filtering, aggregation, and final processing stages. In this example, you can see four parallel lanes corresponding to the max_threads = 4 setting.
Load balancing across processing lanes
Note that the Resize operators in the physical plan above repartition and redistribute data block streams across processing lanes to keep them evenly utilized. This rebalancing is especially important when data ranges vary in how many rows match the query predicates, otherwise, some lanes may become overloaded while others sit idle. By redistributing the work, faster lanes effectively help out slower ones, optimizing overall query runtime.
Why max_threads isn't always respected
As mentioned above, the number of n parallel processing lanes is controlled by the max_threads setting, which by default matches the number of CPU cores available to ClickHouse on the server:
However, the max_threads value may be ignored depending on the amount of data selected for processing:
As shown in the operator plan extract above, even though max_threads is set to 59, ClickHouse uses only 30 concurrent streams to scan the data.
Now let's run the query:
As shown in the output above, the query processed 2.31 million rows and read 13.66MB of data. This is because, during the index analysis phase, ClickHouse selected 282 granules for processing, each containing 8,192 rows, totaling approximately 2.31 million rows:
Regardless of the configured max_threads value, ClickHouse only allocates additional parallel processing lanes when there's enough data to justify them. The "max" in max_threads refers to an upper limit, not a guaranteed number of threads used.
What "enough data" means is primarily determined by two settings, which define the minimum number of rows (163,840 by default) and the minimum number of bytes (2,097,152 by default) that each processing lane should handle:
For shared-nothing clusters:
For clusters with shared storage (e.g. ClickHouse Cloud):
- merge_tree_min_rows_for_concurrent_read_for_remote_filesystem
- merge_tree_min_bytes_for_concurrent_read_for_remote_filesystem
Additionally, there's a hard lower limit for read task size, controlled by:
We don't recommend modifying these settings in production. They're shown here solely to illustrate why max_threads doesn't always determine the actual level of parallelism.
For demonstration purposes, let's inspect the physical plan with these settings overridden to force maximum concurrency:
Now ClickHouse uses 59 concurrent streams to scan the data, fully respecting the configured max_threads.
This demonstrates that for queries on small datasets, ClickHouse will intentionally limit concurrency. Use setting overrides only for testing—not in production—as they can lead to inefficient execution or resource contention.
Key takeaways
- ClickHouse parallelizes queries using processing lanes tied to
max_threads. - The actual number of lanes depends on the size of data selected for processing.
- Use
EXPLAIN PIPELINEand trace logs to analyze lane usage.
Where to find more information
If you'd like to dive deeper into how ClickHouse executes queries in parallel and how it achieves high performance at scale, explore the following resources:
-
Query Processing Layer – VLDB 2024 Paper (Web Edition) - A detailed breakdown of ClickHouse's internal execution model, including scheduling, pipelining, and operator design.
-
Partial aggregation states explained - A technical deep dive into how partial aggregation states enable efficient parallel execution across processing lanes.
-
A video tutorial walking in detail through all ClickHouse query processing steps:

